
4 Lesser-Known DevTools Tricks
By Angela Derewieńczuk, QA Engineer
Nowadays, we have more testing-supportive tools than there are cars in all the 'Fast and Furious' movies. Similar to those high-speed cars, testing tools can also operate quickly, although I haven't seen them exhibit any fury😉
In both scenarios, appreciating the classics holds value. To be honest, my knowledge of classic cars is as limited as a Labrador's grasp of quantum physics. Therefore, let's move on to the enduring aspects of testing and explore the uncharted capabilities presented by these iconic DevTools.
Below, I'll uncover a few lesser-known tricks that might have escaped your radar, and trust me, they can greatly help you in your work.
It's worth noting that all the tricks I'll be describing were performed in Chrome DevTools. While they may work smoothly there, they may not work as expected in other web browsers.
Exploring the Potential of DevTools Device Emulation
If you work with web applications, you're likely familiar with using browser DevTools to inspect and debug websites. However, there's a hidden feature, where DevTools can also simulate different devices, like smartphones and tablets. This enables you to test website behavior on various devices beyond just your own.
This is particularly useful since none of us have every kind of device and screen size available at home.

By simulating devices, you can verify how your website reacts to different screen sizes, making sure that your content stays functional and visually pleasing across a variety of devices. Yet, like any tool, the DevTools Device Emulation comes with its limitations.
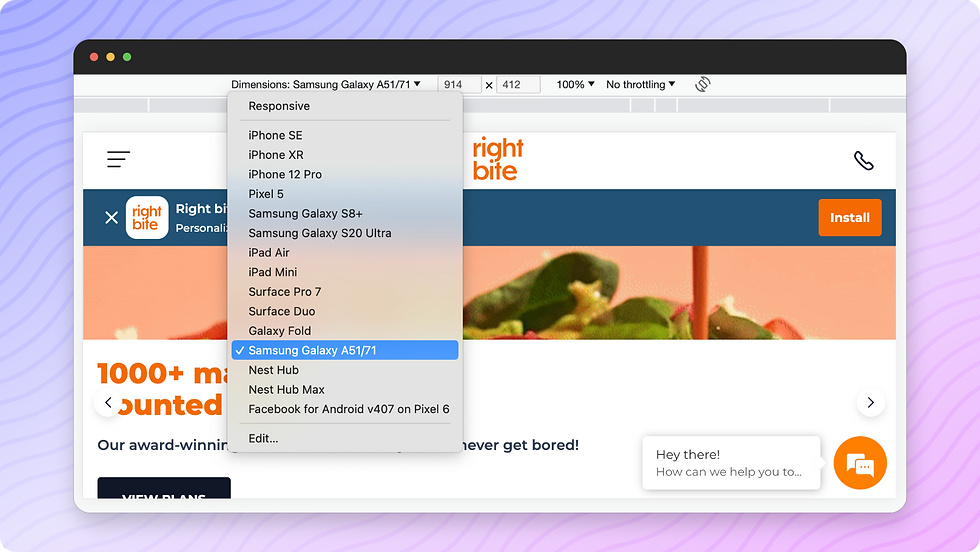
Picture it like a skilled actor taking on a role.
They can resemble and behave like the character they're portraying, such as a historical figure, but they might miss some details. Just as an actor can mimic a smile or their way of speaking, they won't capture every single movement or subtle aspect perfectly.
In a similar manner, the DevTools Device Emulation functions as an adept actor mimicking devices. It grasps the basics – how things appear and function on the surface. However, when it comes to the complicated aspects like the device's operating system and CPU, it can't replicate them. As a result, they might not accurately represent the performance and functionality of your website on actual devices.
Network Throttling: Unveiling Hidden Performance Insights
In modern web development, performance is critical. With the availability of high-speed internet connections, our expectations for rapid web application experiences continue to rise.
But what if there's slow internet due to provider issues? Or users access apps in remote areas with sluggish connections?
During such situations, web applications might not behave as expected, potentially leading to errors. Here, Network Throttling steps in, letting you simulate various network scenarios. From high-speed to sluggish connections, or even, offline mode, it helps you to ensure that your app stays strong across user experiences. It can help to identify bottlenecks and uncover unseen bugs.

On the other hand, while Network Throttling is invaluable, it still can't perfectly replicate the real-world network behavior - there may still exist subtleties it doesn't capture. It's crucial to remember that network speed is just one component of the intricate performance puzzle.
Pausing Code Execution with Breakpoint
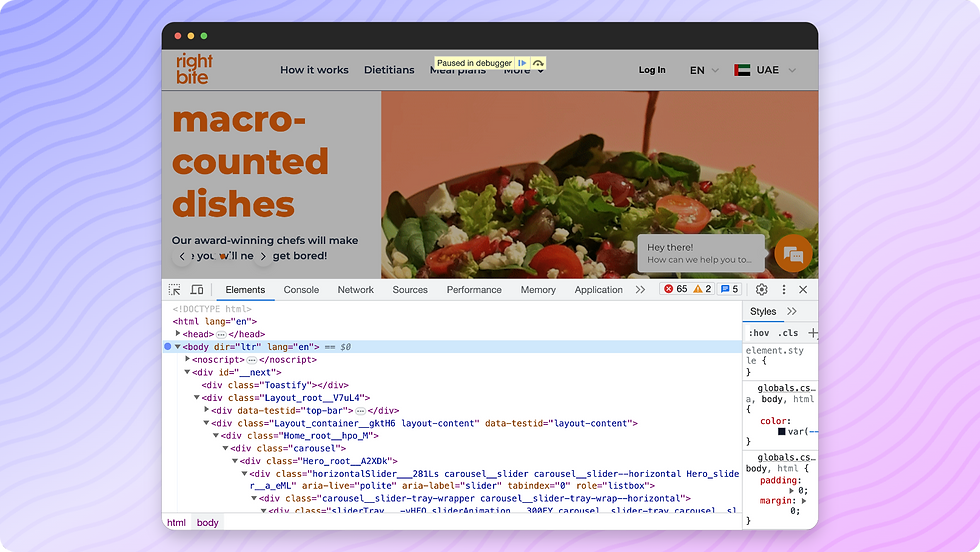
Breakpoint enables you to halt the execution of code at specific lines in the Document Object Model (DOM). This capability proves invaluable when you need the web application to pause at a particular point, allowing you to capture disappearing web elements, messages, or specific behaviors effectively.
For instance, consider a scenario where you're aiming to create a locator for a window that appears temporarily. This window becomes visible after a specific action. To achieve this, you can set a breakpoint in the DOM where changes occur within the subtree.
To set a Breakpoint, you can follow these steps:
Open DevTools;
Navigate to the Elements tab;
Right-click on the HTML element where you want to set a breakpoint;
In the context menu that appears after right-clicking, you'll see an option called "Break on". Hover over this option to see more choices:
Subtree modifications: Breaks when a child element is added, removed, or modified within the selected element.
Attribute modifications: Breaks when attributes of the selected element are modified.
Node removal: Breaks when the selected element or one of its parent elements is removed from the DOM.

Even if you don’t know precisely where the subtree will be modified, you can establish the breakpoint on the <body> element. Then, you should use the blue arrow button visible on the screen, labeled as “Resume script execution”, to continue script execution until the desired window becomes visible.
Emulating a Focused Page
Web applications are becoming more complex, with numerous interactive functionalities now being the standard. While these designs are visually appealing to users, they often pose significant challenges for engineers. Why is that so?
Let's imagine what happens if certain overlay elements, like dropdown menus, suddenly disappear when focus is lost on the element. How can we effectively address and debug these elements?
Just a moment ago, we explored the concept of setting breakpoints. However, our toolkit has another intriguing method – the ability to emulate a focused page.
To utilize this feature, open DevTools and bring up the command palette with a simple keyboard shortcut (Ctrl+Shift+P on Windows or Cmd+Shift+P on macOS). In the search bar, type "Emulate a focused page", and voilà! Let the magic happen✨

Unveiling a World of Testing and Debugging Tricks
As we wrap up this journey through DevTools, keep in mind that the tricks we've explored are just the beginning.
There are many more features in DevTools waiting for you to uncover, each designed to make your testing and debugging tasks easier. I hope these tricks prove useful in your daily work!


Nice blog! Renewable energy project finance supports clean energy developments by providing structured funding for sustainable infrastructure and investment initiatives. Effective financing considers project feasibility, capital requirements, risks, cash flows, and repayment strategies. Strong financial planning helps developers manage resources and advance renewable projects successfully.
The breakpoint trick for catching disappearing elements is a game changer—I've spent way too long trying to inspect stuff that vanishes before I can click on it. Definitely trying this next time instead of rage-clicking. AI Face Analysis
The insight on using Network Throttling to simulate various internet conditions is particularly valuable. It’s a reminder that real-world scenarios often diverge from ideal conditions, affecting user experience. As someone who focuses on web application testing, I find that understanding these nuances is crucial. For those interested in optimizing their web performance, exploring tools like GWYF Guide can also provide additional strategies for effective testing.
I have tried several video editing apps, but inshot pro apk continues to be my favorite because of its simplicity and powerful features. The editing tools are easy to use, and the app performs smoothly without making the process complicated. I can add music, transitions, text, stickers, and effects in just a few minutes. The export quality is excellent, and my videos always look polished and professional. I also like the wide range of customization options available for every project. It is perfect for creating content for YouTube, Instagram, TikTok, and other platforms. Overall, InShot is a dependable editing app that provides everything I need to produce creative and engaging videos with minimal effort.
When we explore the world of technology small improvements often create a big impact. Just like developers use hidden tools and smart techniques to improve their workflow the construction industry also depends on innovative methods to improve speed accuracy and overall performance. Interestingly this connection between technology and practical solutions can be seen in modern prefab construction where planning design and execution work together to create reliable structures.
One area where this approach has become highly valuable is government infrastructure. Security departments require buildings that are strong comfortable and capable of handling long-term usage. Modern insulated structures help achieve these goals by reducing construction time while maintaining durability. A good example of this approach is the PUF Panel Police Barracks…